Last updated on June 23, 2025
The transition to a net zero economy represents both the greatest challenge and opportunity of our time. As global temperatures continue to rise, businesses, governments, and investors are increasingly recognising that ambitious climate action is not only an environmental imperative but also a powerful economic driver.
With climate impacts and stakeholder pressure both intensifying, the focus has decisively shifted from setting targets to delivering measurable results. Organisations are now embedding sustainability into their core operations and strategies, recognising that those who can effectively translate ambition into action gain a competitive advantage in rapidly evolving markets.
This comprehensive guide examines the current state of net zero commitments, green growth trends, and the innovative companies leading the transition to a sustainable future. For deeper insights into the tech sector’s specific journey to net zero, including case studies and practical guidance, see The Tech Zero Report.
What Is Net Zero?
Defining the Concept
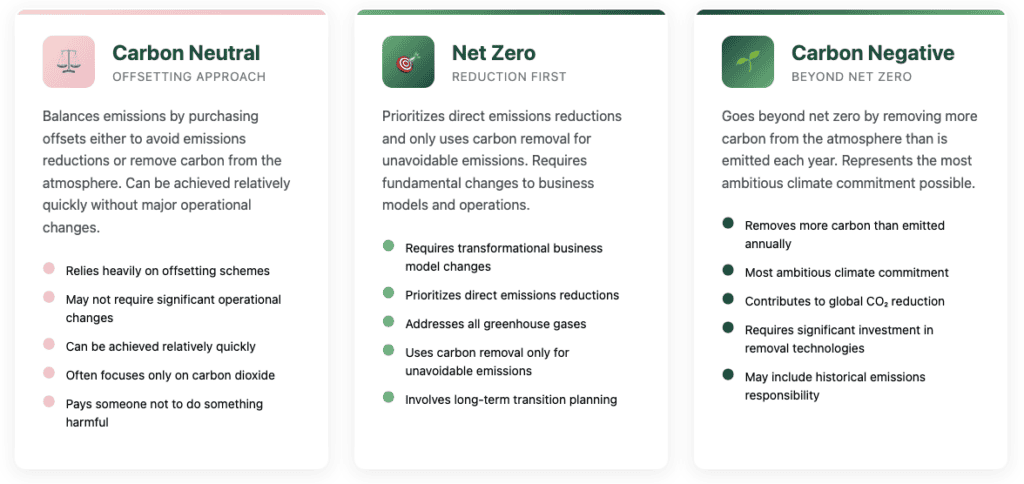
Net zero refers to the balance between the amount of greenhouse gases (GHGs) produced and the amount removed from the atmosphere. At its core, achieving net zero means reducing emissions as much as possible, then removing an equivalent amount of any remaining emissions that cannot be eliminated. Unlike carbon neutrality, which often relies heavily on offsetting, net zero requires fundamental changes to business models and operations to achieve deep emissions reductions.
The concept has become the north star for climate action globally, with the Intergovernmental Panel on Climate Change (IPCC) identifying net zero CO₂ emissions by 2050 as necessary to limit global warming to 1.5°C above pre-industrial levels (IPCC, 2023).
Carbon Neutrality vs. Net Zero vs. Carbon Negative: Understanding the Difference
While often used interchangeably, these terms represent distinct approaches to climate action:
The Path to Net Zero
The journey to net zero typically follows several key stages:
Measurement: Establishing baseline emissions across Scopes 1, 2, and 3
Target-setting: Creating science-based reduction targets aligned with 1.5°C pathways
Reduction: Implementing strategies to dramatically cut emissions across operations
Transformation: Redesigning business models, products, and services
Removal: Investing in high-quality carbon removal for unavoidable emissions
Reporting: Providing transparent, verified updates on progress
This structured approach enables organisations to systematically address their climate impact while building the operational resilience needed in a carbon-constrained world.
Global Net Zero Targets by Country
The landscape of national climate commitments has evolved rapidly since the 2015 Paris Agreement, with a growing number of countries establishing legally binding net zero targets. As of early 2025, 153 countries representing over 90% of global GDP have now announced or are considering net zero targets (Energy & Climate Intelligence Unit, 2024).
Major Economies and Their Commitments
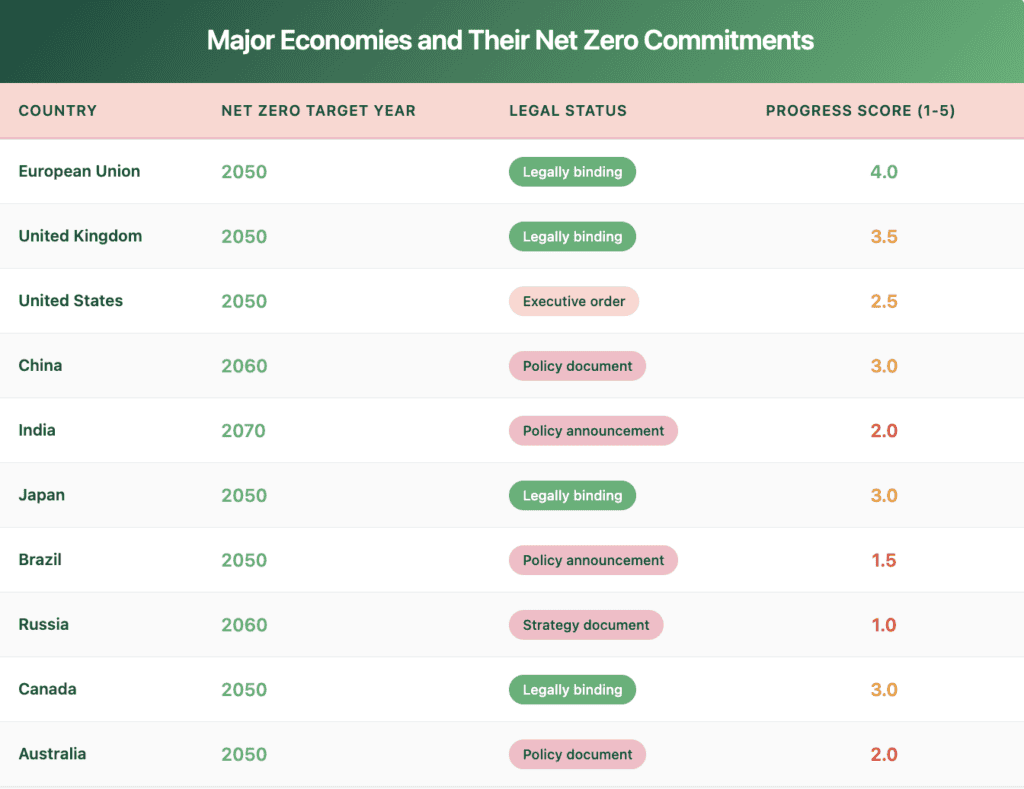
Source: Climate Action Tracker (2024), World Resources Institute (2024)
Implementation Gaps and Progress Indicators
While commitments are important, implementation determines impact. Analysis from Climate Action Tracker (2024) shows significant gaps between pledges and policies. Even with full implementation of current policies, the world is on track for 2.7°C of warming by 2100 – well above the Paris Agreement goals.
Key implementation challenges include:
Policy alignment: Ensuring that economic, energy, and industrial policies support climate goals
Infrastructure transformation: Rebuilding energy systems, transportation networks, and buildings
Finance mobilisation: Securing sufficient investment for low-carbon transitions
Just transition: Managing economic impacts on communities dependent on fossil fuels
International cooperation: Coordinating action across borders, particularly for supply chains
Countries leading in implementation have established detailed sector-by-sector transition plans, robust carbon pricing mechanisms, and regular progress reviews. The UK’s Carbon Budget system, which sets legally binding 5-year emissions caps, exemplifies a structured approach to implementation.
Top Green Growth Stats (2025)
The transition to a net zero economy is creating unprecedented economic opportunities. What began as a niche environmental concern has evolved into a mainstream economic transformation, with green sectors now outpacing growth in conventional industries.
Economic Scale and Growth Projections
- The global green economy now represents approximately $4.5 trillion or about 5% of global GDP, with projections suggesting growth to 10-15% of global GDP by 2030 (BloombergNEF, 2024)
- Clean energy investments reached $1.8 trillion in 2024, exceeding fossil fuel investments for the third consecutive year (International Energy Agency, 2025)
- Green jobs are growing at 8% annually compared to 2% for traditional sectors, with over 15 million people now employed in renewable energy alone (International Renewable Energy Agency, 2024)
Carbon Pricing Adoption
Carbon pricing mechanisms – either through carbon taxes or emissions trading systems – continue to expand globally:
- As of early 2025, 71 carbon pricing initiatives are now implemented worldwide, covering approximately 23% of global emissions (World Bank Carbon Pricing Dashboard, 2025)
- The average carbon price in developed economies reached $35/tonne in 2024, though this remains below the $75-100/tonne range economists estimate is needed to drive transformation (OECD, 2024)
- The EU Emissions Trading System (ETS) price reached €80/tonne in 2024, creating strong incentives for industrial decarbonisation
- Border carbon adjustment mechanisms, pioneered by the EU, are driving global convergence in carbon pricing approaches
Investment Flows and Green Finance
Green finance has moved from niche to mainstream, with significant implications for capital allocation:
- Sustainable investing assets under management reached $53 trillion globally in 2024, representing more than 35% of professionally managed assets (Global Sustainable Investment Alliance, 2024)
- Green bond issuance hit a record $1.2 trillion in 2024, with corporate issuers leading growth (Climate Bonds Initiative, 2025)
- Climate tech venture funding reached $70 billion in 2024, with particular growth in hard-to-abate sectors (PwC State of Climate Tech, 2025)
- Financial institutions with over $130 trillion in assets have now committed to net zero targets through the Glasgow Financial Alliance for Net Zero
Who Emits the Most?
Understanding emissions profiles at national, sectoral, and corporate levels is essential for targeting climate action effectively.
Current Emissions by Country
The distribution of carbon emissions remains highly uneven, with just 20 countries responsible for approximately 80% of global greenhouse gas emissions.
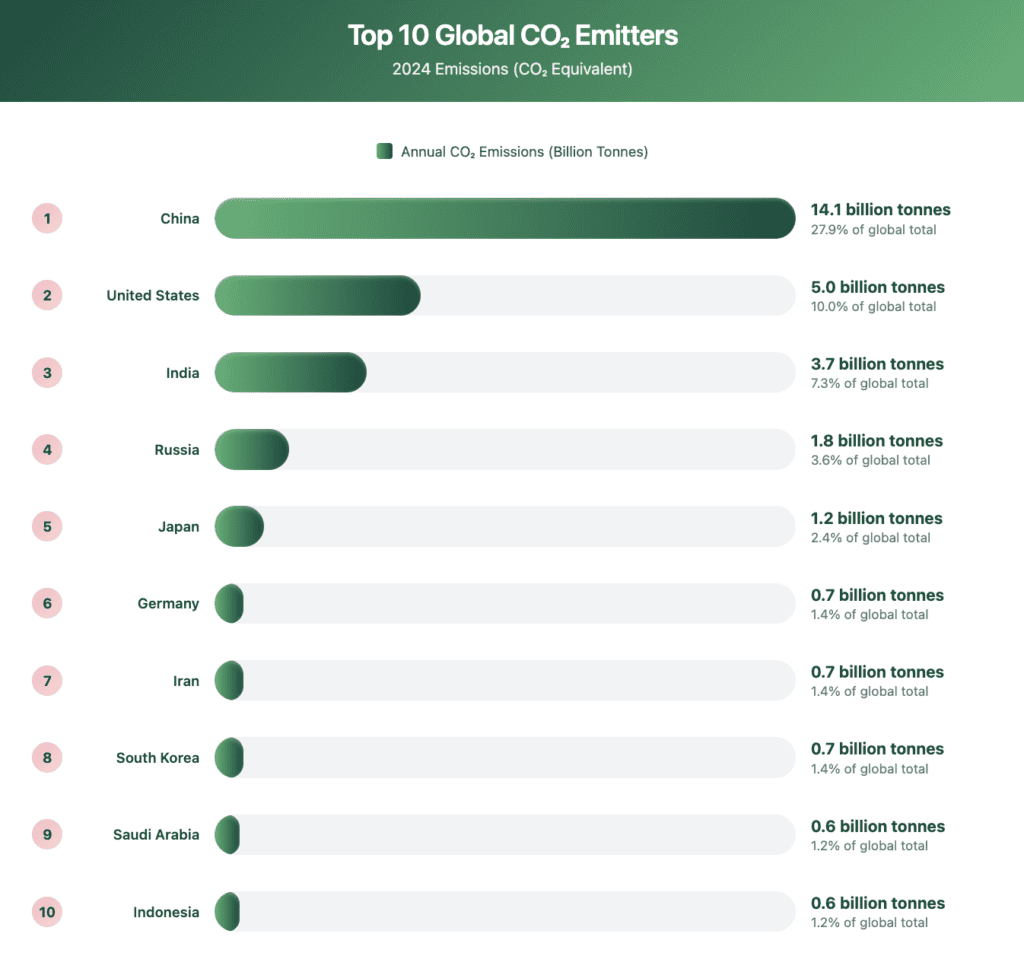
Source: Global Carbon Project (2024)
Historical Responsibility for Climate Change
Current emissions tell only part of the story. Historical emissions – the accumulated emissions since the start of industrialisation – more closely correlate with responsibility for climate change given the long-lived nature of greenhouse gases.
Carbon Brief’s analysis of cumulative CO₂ emissions from 1850-2023 shows that:
- The United States has contributed approximately 20% of the global total
- China is responsible for around 11%
- Russia 7%, Brazil 5%, and Indonesia 4%
- European nations including Germany (4%) and the UK (3%) also feature prominently
This historical perspective is central to international climate negotiations and the principle of “common but differentiated responsibilities” enshrined in UN climate agreements.
Per Capita vs. Total Emissions
When considering emissions on a per person basis, the picture changes dramatically:
Top Per Capita Emitters (2024, tonnes CO₂e per person):
Qatar: 37.0
Kuwait: 25.3
United Arab Emirates: 23.9
Australia: 22.5
United States: 15.3
Canada: 15.1
Saudi Arabia: 15.0
Kazakhstan: 14.6
South Korea: 13.9
Russia: 12.4
By comparison, the global average is approximately 6.3 tonnes per person, with India at 2.7 tonnes and most African nations below 2 tonnes per person.
Sectoral Emissions Distribution
Understanding emissions by sector helps identify priority areas for decarbonisation:
- Energy (electricity and heat): 31%
- Industry: 24%
- Transportation: 15%
- Agriculture: 12%
- Buildings: 8%
- Land use change and forestry: 7%
- Waste: 3%
Source: Climate Watch, World Resources Institute (2024)
Within these broad categories, specific high-impact activities include:
- Coal-fired power generation
- Steel and cement production
- Livestock and rice cultivation
- Deforestation
- Aviation and shipping
The Technology Sector’s Growing Emissions Profile
According to The Tech Zero Report, the technology industry, while historically representing a smaller share of global emissions, is experiencing rapid growth in its carbon footprint. The tech industry currently accounts for 3-4% of global carbon emissions, with this figure rising due to the exponential growth in data center construction and AI workloads.
The data reveals concerning trends among major tech companies:
- Microsoft’s greenhouse gas emissions have grown by 29% since 2020 due to the construction of data centers designed to support AI workloads
- Google’s greenhouse gas emissions in 2023 were 48% higher than in 2019, attributed to data center energy consumption and supply chain impacts
- According to some estimates, actual data center emissions could be around 662% higher than what Big Tech companies report
However, the tech sector also demonstrates significant potential for emissions reduction. By 2050, digital technologies alone – including AI, cloud computing, and IoT – have the potential to cut global emissions from the highest-emitting sectors by 20%.
Climate Leaders: Companies Driving Net Zero
Corporate climate leadership has evolved significantly from corporate social responsibility to strategic business transformation. Leading companies are now embedding sustainability into their core business models, governance structures, and operational practices.
Characteristics of Corporate Climate Leadership
True climate leaders share several common characteristics:
Science-based targets: Adopting emissions reduction goals aligned with 1.5°C pathways
Strategic integration: Embedding sustainability into core business strategy and governance
Supply chain engagement: Addressing Scope 3 emissions through supplier requirements
Innovation focus: Developing products and services for a low-carbon economy
Transparent reporting: Providing comprehensive, verified climate disclosures
Policy advocacy: Supporting ambitious climate policy frameworks
Collaboration: Participating in industry initiatives to drive sectoral transformation
Companies Leading the Way
Microsoft: Beyond Carbon Neutrality to Carbon Negative
Microsoft exemplifies corporate climate leadership with its comprehensive approach. In 2020, the company announced plans to become carbon negative by 2030 and by 2050 to remove all carbon it has emitted since its founding in 1975. Key elements of Microsoft’s approach include:
- Internal carbon fee ($15/tonne) applied across all scopes of emissions
- $1 billion Climate Innovation Fund supporting carbon reduction and removal technologies
- Detailed annual Environmental Sustainability Report providing transparency on progress
- Supply chain engagement requiring emissions disclosure from suppliers
- Investment in emerging carbon removal technologies
Patagonia: Business Model Innovation for Sustainability
Outdoor apparel company Patagonia has redefined corporate purpose around environmental stewardship. In 2022, founder Yvon Chouinard transferred ownership of the company to a trust and nonprofit organisation structured to channel all profits toward fighting climate change. Beyond this radical governance innovation, Patagonia’s climate leadership includes:
- Commitment to become carbon neutral across entire supply chain by 2025
- Transition to 100% renewable energy for owned operations
- Durable product design and repair services to extend product lifetimes
- Recycled and regenerative organic materials throughout product lines
- Advocacy for public lands protection and regenerative agriculture
Ørsted: Corporate Transformation from Fossil Fuels to Renewables
Danish energy company Ørsted (formerly DONG Energy) has undergone one of the most dramatic corporate transformations in the energy sector. Once among the most coal-intensive utilities in Europe, Ørsted has transformed into the world’s largest developer of offshore wind power. Key aspects of Ørsted’s journey include:
- 98% reduction in coal consumption since 2006
- Target to be carbon neutral in energy generation by 2025
- Commitment to phase out all coal by 2023
- 86% reduction in carbon intensity since 2006
- Investment of over $30 billion in green energy
- Target for net-zero emissions across entire value chain by 2040
This transformation has been both environmentally and financially successful, with Ørsted’s market value increasing more than 300% since its IPO.
Big Tech’s Climate Leadership and Challenges
The world’s largest technology companies present a complex picture of climate leadership. While they are among the largest corporate purchasers of renewable energy globally, they also face significant challenges in managing their growing emissions footprints.
Leading in Renewable Energy Procurement (data from The Tech Zero Report)
- Amazon, Google, and Meta are the largest corporate purchasers of renewable energy globally.
- In 2022, six out of the top 10 US purchasers of renewable energy were tech companies.
- Half of the leading ten tech companies based on market capitalisation are powered by 100% renewable energy sources.
Mixed Emissions Performance Despite their renewable energy commitments, emissions performance varies significantly across Big Tech:
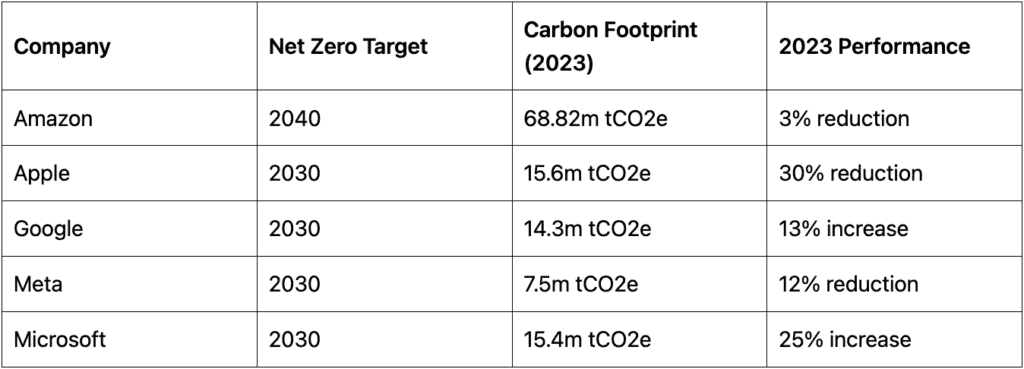
These varying results highlight the challenge of accounting for different offsetting methodologies and the impact of rapid AI-driven infrastructure expansion.
Tech Zero: Collective Action in the Technology Sector
The Tech Zero initiative, launched by Tech Nation in partnership with leading technology companies, represents a significant collective action approach to climate leadership in the tech sector. Since its inception in 2021, Tech Zero has grown to include 358 members across 33 countries, demonstrating the industry’s commitment to climate action.
Demonstrated Impact
- Tech Zero members have reduced their emissions by 24% on average since 2021.
- In 2024 alone, members achieved an 11% reduction in emissions.
- One in three Tech Zero members have published annual greenhouse gas emissions reports, significantly outperforming comparable schemes which track at less than 10%.
Key Insights from Tech Zero Members
- 85% of members joined because taking climate action is “the right thing to do”.
- 78% report Purchased Goods and Services (Scope 3) as their biggest source of emissions.
- 50% identify data centers and cloud services as significant contributors to their emissions.
- 92% would collaborate with competitor companies to reduce carbon emissions.
B Corps and Purpose-Driven Businesses
Beyond these large corporate examples, a growing ecosystem of certified B Corporations is integrating climate action into their business models. These companies meet rigorous standards of social and environmental performance, accountability, and transparency.
Notable climate-focused B Corps include:
- Allbirds: Carbon footprint labels on all products and commitment to near-zero emissions by 2030
- Ecosia: Search engine that uses profits to plant trees, having funded over 150 million plantings
- Toast Ale: Brewery that upcycles surplus bread into beer and donates profits to charity
- Climeworks: Direct air capture company removing CO₂ from the atmosphere (click here to see insights from Climeworks’ CEO, Christoph Gebald.)
- Ecovative: Materials company using mycelium as a sustainable alternative to plastics
Green Startups & Climate Tech Funding
The climate tech sector has emerged as one of the most dynamic areas in the startup ecosystem, with record levels of funding flowing to innovative solutions across sectors. Unlike the cleantech boom and bust of 2006-2011, today’s climate tech ecosystem is characterised by greater technological maturity, stronger policy support, and clear market demand.
Climate Tech Investment Landscape
Investment in climate technology continues to show resilience even amid broader technology market fluctuations, climate tech trends include:
- Venture capital and private equity investment in climate tech reached approximately $70 billion in 2024, maintaining the momentum of recent years despite tighter monetary conditions (BloombergNEF, 2025).
- The number of climate tech unicorns (startups valued at over $1 billion) has grown to more than 90 globally, up from just 12 in 2020 (Cleantech Group, 2024).
- Climate tech funding represented more than a quarter of every venture dollar invested globally in 2022, with European startups raising record venture rounds. Click here to see the 23 Climate Tech startups to watch!
- Corporate venture capital and strategic investment now accounts for approximately 30% of total climate tech funding, reflecting mainstream corporate interest.
- Investment is diversifying geographically, with Asia and Europe now accounting for 55% of global climate tech funding (PwC State of Climate Tech, 2024).
Most Funded Green Startups (2024-2025)
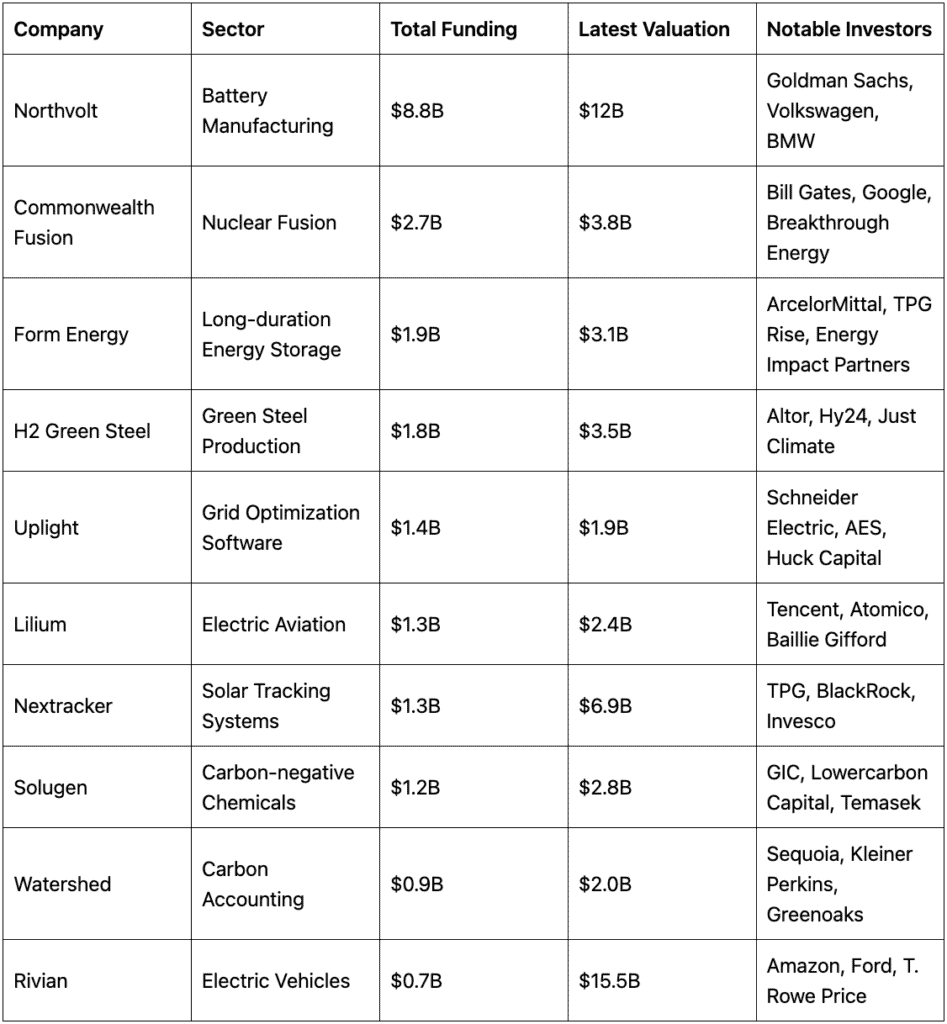
Source: Crunchbase, PitchBook, company announcements (2025)
Emerging Startup Hubs for Climate Innovation
While Silicon Valley remains important, climate tech innovation has become increasingly geographically distributed:
- London, UK: Leading in climate fintech, carbon accounting, and sustainable consumer brands, with Tech Nation reporting a 144% increase in climate tech investment between 2020-2023 (Tech Nation, 2023)
- Berlin, Germany: Strong in energy transition, green mobility, and industrial tech
- Stockholm, Sweden: Hub for circular economy, battery technology, and green steel
- Singapore: Emerging centre for climate adaptation, agritech, and sustainable aviation
- Tel Aviv, Israel: Leading in water technology, agritech, and energy management
- Boston, USA: Hub for hard tech, advanced materials, and fusion energy
- Melbourne, Australia: Growing ecosystem for agricultural technology and renewable integration
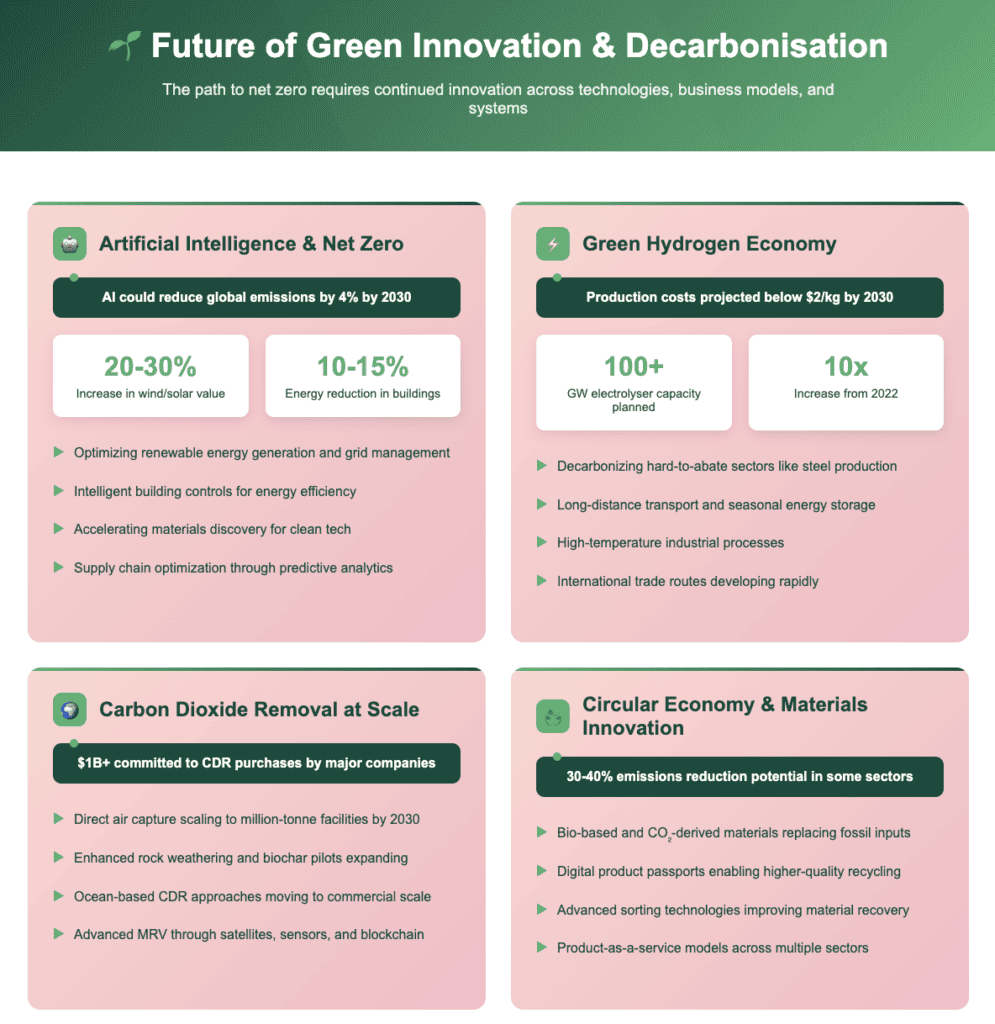
Future of Green Innovation & Decarbonisation
The path to net zero will require continued innovation across technologies, business models, and systems. Several key trends are likely to shape the landscape of climate innovation in the coming years.
Emerging Technology Trends
Policy and Market Trends
Carbon Border Adjustments
As carbon pricing mechanisms mature, border adjustments are emerging to address competitiveness and carbon leakage concerns:
- The EU Carbon Border Adjustment Mechanism (CBAM) began its transitional phase in 2023, with full implementation scheduled for 2026
- Other major economies including the UK, Canada, and potentially the US are developing similar mechanisms
- These policies are driving greater convergence in carbon pricing and corporate carbon accounting practices globally
Climate-Aligned Finance
Financial institutions are developing new approaches to align capital allocation with climate goals:
- Climate stress testing is being incorporated into risk management by central banks and financial institutions
- Taxonomies of sustainable activities are being established to guide investment, with the EU Taxonomy as the most developed example
- Transition finance frameworks are emerging to support high-carbon sectors in decarbonising
- Blended finance vehicles are being designed to mobilise private capital for climate solutions in emerging markets
Net Zero Energy Systems
Energy systems are being reimagined for a zero-carbon world:
- Integration of high renewable penetration (80%+) through advanced grid management, storage, and demand response
- Electrification of end uses including transportation, buildings, and industry
- Sector coupling between electricity, heat, and gas networks
- Distributed energy resources and community energy systems
Strategic Implications for Organisations
For businesses navigating the net zero transition, several strategic imperatives emerge:
Climate Governance: Integrating climate considerations into board-level oversight, executive compensation, and strategic planning
Net Zero Roadmapping: Developing detailed, sector-specific decarbonisation pathways with interim targets
Green Competitiveness: Positioning for advantage in carbon-constrained markets through product innovation and efficiency
Climate Risk Management: Assessing and addressing physical and transition risks across operations and supply chains
Green Skills Development: Building internal capabilities for the low-carbon transition
Policy Engagement: Constructively engaging with evolving climate policy frameworks
Conclusion: From Commitments to Impact
The net zero transition represents a fundamental economic transformation on par with the industrial and digital revolutions. While the challenges are substantial, the mobilisation of innovation, capital, and political will provides reason for optimism.
As this report has illustrated, we are witnessing an unprecedented convergence of technological progress, policy support, financial commitment, and public demand for climate action. Early movers in this transition are demonstrating that climate leadership can drive business value through innovation, operational efficiency, talent attraction, and strategic positioning for a decarbonised future.
Yet significant gaps remain between current trajectories and Paris Agreement goals. Closing these gaps will require:
Accelerated deployment of existing clean technologies
Breakthrough innovation in hard-to-abate sectors
Mobilisation of trillions in climate finance
Just transition policies that ensure benefits are widely shared
Strengthened international cooperation
For startups, investors, and established companies alike, the net zero transition creates unprecedented opportunities to develop solutions to one of humanity’s greatest challenges while building successful, purpose-driven enterprises.
As Hannah Jones, CEO of the Earthshot Prize, observed: “We have to do things that are different. We’re going to have to break rules. We’re going to have to be courageous, bold, all of us with every power and privilege we have” (Tech Nation’s Sustainability Leadership Report, 2024).
The shift from climate commitments to tangible action is underway. Those who lead this transition will not only contribute to addressing the climate crisis but will also help shape the economy of the future.
References
BloombergNEF. (2024). Energy Transition Investment Trends 2024.
BloombergNEF. (2025). Climate Tech Investment Trends 2025.
Carbon Brief. (2021). Analysis: Which countries are historically responsible for climate change. https://www.carbonbrief.org/analysis-which-countries-are-historically-responsible-for-climate-change/
Climate Action Tracker. (2024). Global update: Climate target updates slow as science demands more urgent action.
Climate Bonds Initiative. (2025). Sustainable Debt Global State of the Market 2024.
Cleantech Group. (2024). Global Cleantech 100: Leading Companies and Themes in Sustainable Innovation.
Ellen MacArthur Foundation. (2024). Completing the Picture: How the Circular Economy Tackles Climate Change.
Energy & Climate Intelligence Unit. (2024). Net Zero Tracker Annual Report.
Global Carbon Project. (2024). Global Carbon Budget 2024.
Global Sustainable Investment Alliance. (2024). Global Sustainable Investment Review 2024.
International Energy Agency. (2025). World Energy Investment 2025.
International Renewable Energy Agency. (2024). Renewable Energy and Jobs Annual Review 2024.
IPCC. (2023). Climate Change 2023: Synthesis Report. Contribution of Working Groups I, II and III to the Sixth Assessment Report of the Intergovernmental Panel on Climate Change.
Microsoft. (2020). Microsoft will be carbon negative by 2030. https://blogs.microsoft.com/blog/2020/01/16/microsoft-will-be-carbon-negative-by-2030/
OECD. (2024). Pricing Greenhouse Gas Emissions: Turning Climate Targets into Climate Action.
PwC. (2024). State of Climate Tech 2024.
PwC. (2025). State of Climate Tech 2025.
Tech Nation. (2023). Climate Tech Report 2023.
Tech Nation. (2024). Sustainability Leadership: Action Speaks.
Tech Zero. (2024). The Tech Zero Report.
World Bank. (2025). Carbon Pricing Dashboard.
World Economic Forum. (2024). Harnessing Artificial Intelligence to Accelerate the Energy Transition.
World Resources Institute. (2024). Climate Watch Data.